Example 1:
Opening Age
Groups openings by how long they have been open.
Benefits & Use Cases
Quickly spot fresh roles and flag openings that may be stalled or going stale.
- See how long openings have been live so you can focus on those that are stuck, slowing down, or going stale.
- Add this field to recruiter dashboards to track workload balance
- Flag stale openings during weekly pipeline reviews
- Create a Calculated Field on the Openings object.
-
Use Duration (Opened At → Today) as your key field.
-
Add filter buckets: 0–30, 31–60, 61–90, 91+.
💡Take it a step further: Pair with Recruiter as a grouping field to see who is carrying older requisitions.
Empty space, drag to resize
Example 2:
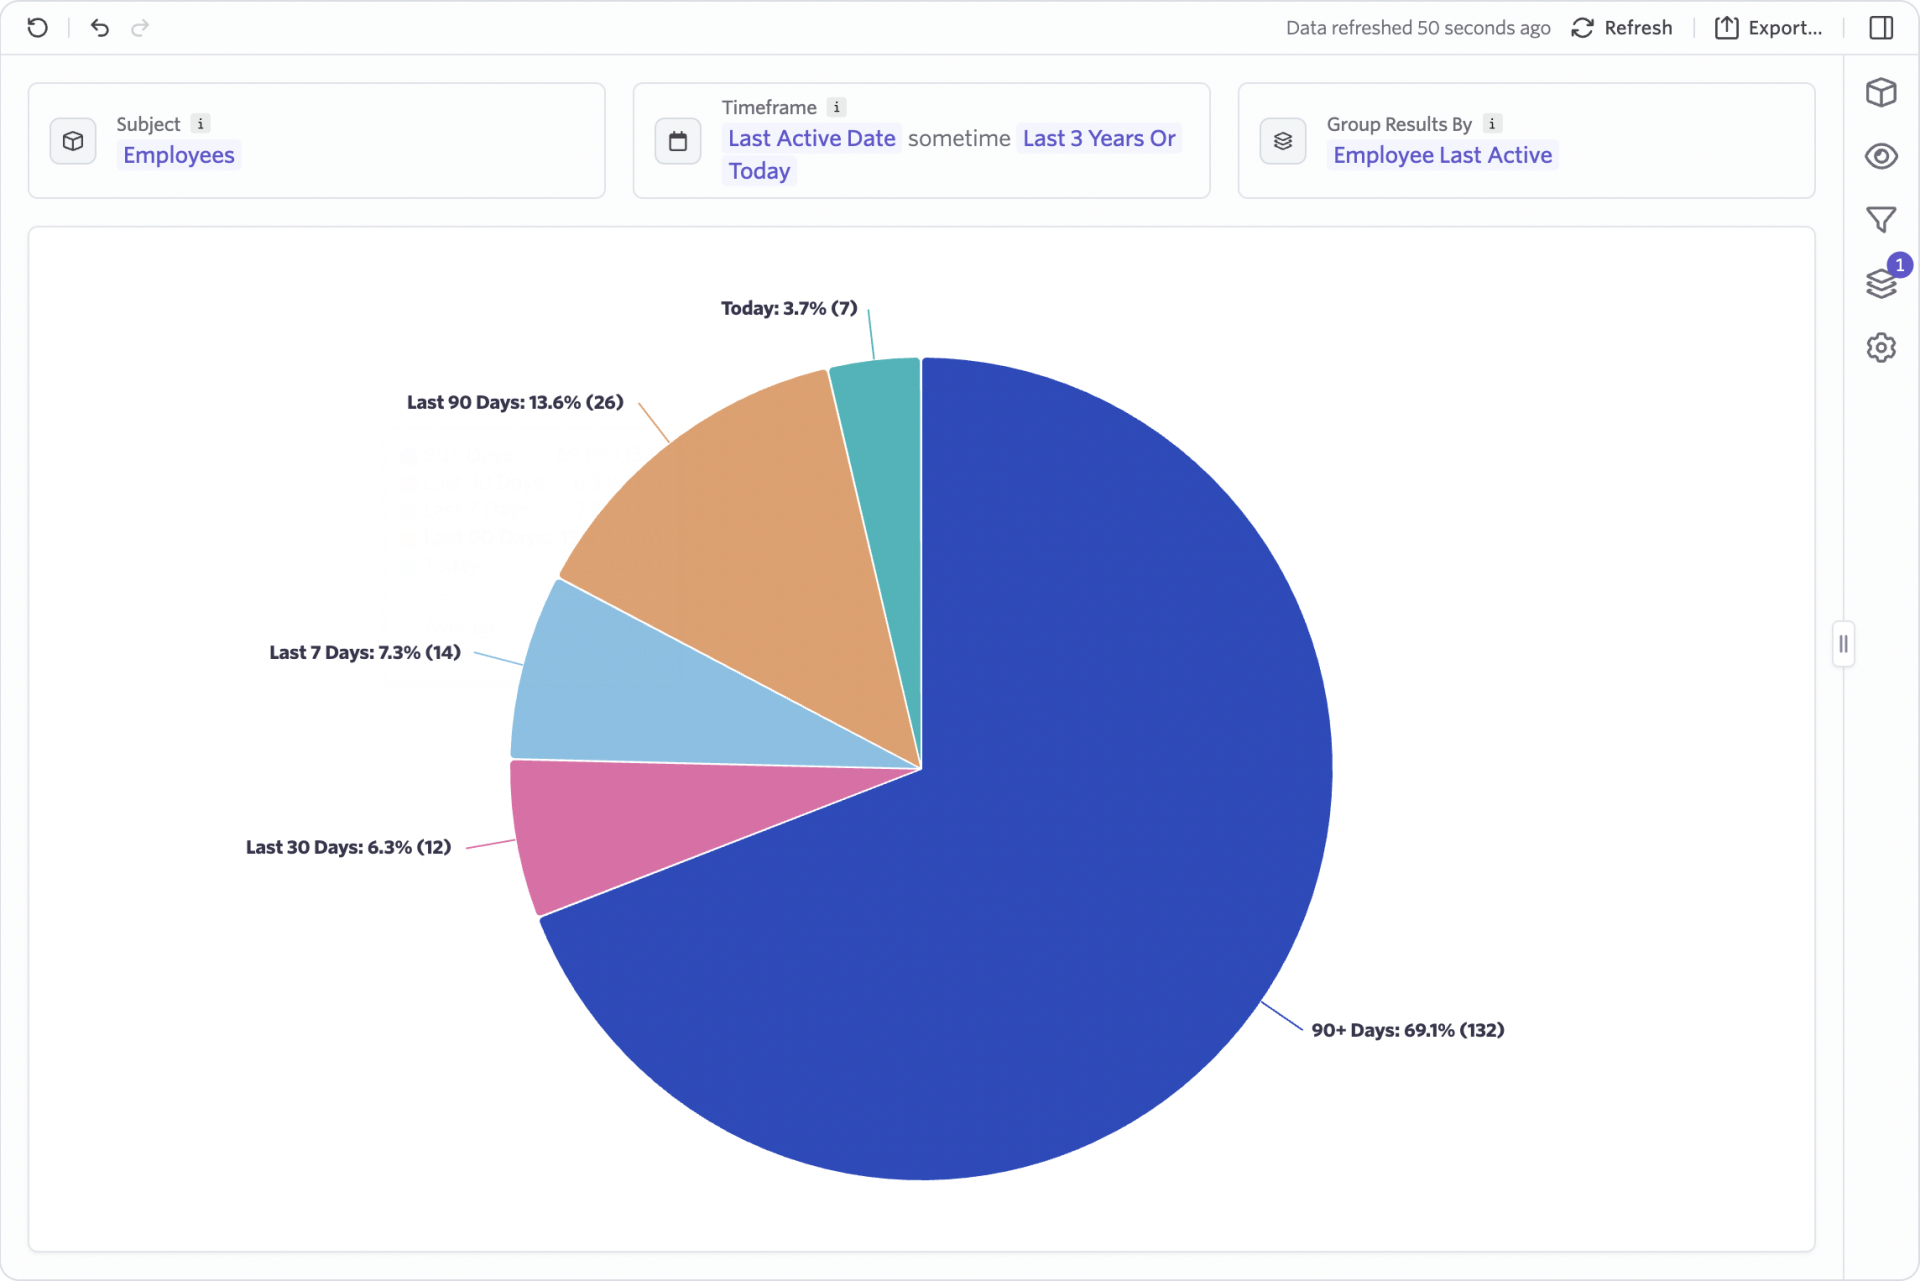
Employee Last Active
Groups employees by the date they were last active in Ashby.
Benefits & Use Cases
Understand user trends — who’s logging in frequently, who’s falling off, and how adoption is shifting over time.
- Track overall product adoption
- Identify users who may need training or nudges
- Spot power users and champions
- Create a Calculated Field on the Employees object.
-
Use Last Active Date as your key field.
-
Add filter buckets: Today, Last 7 Days, Last 30 Days, etc.
💡Take it a step further: Surface this field in a Time Series to show adoption momentum — increasing logins over time is a strong signal of success.
Empty space, drag to resize
Example 3:
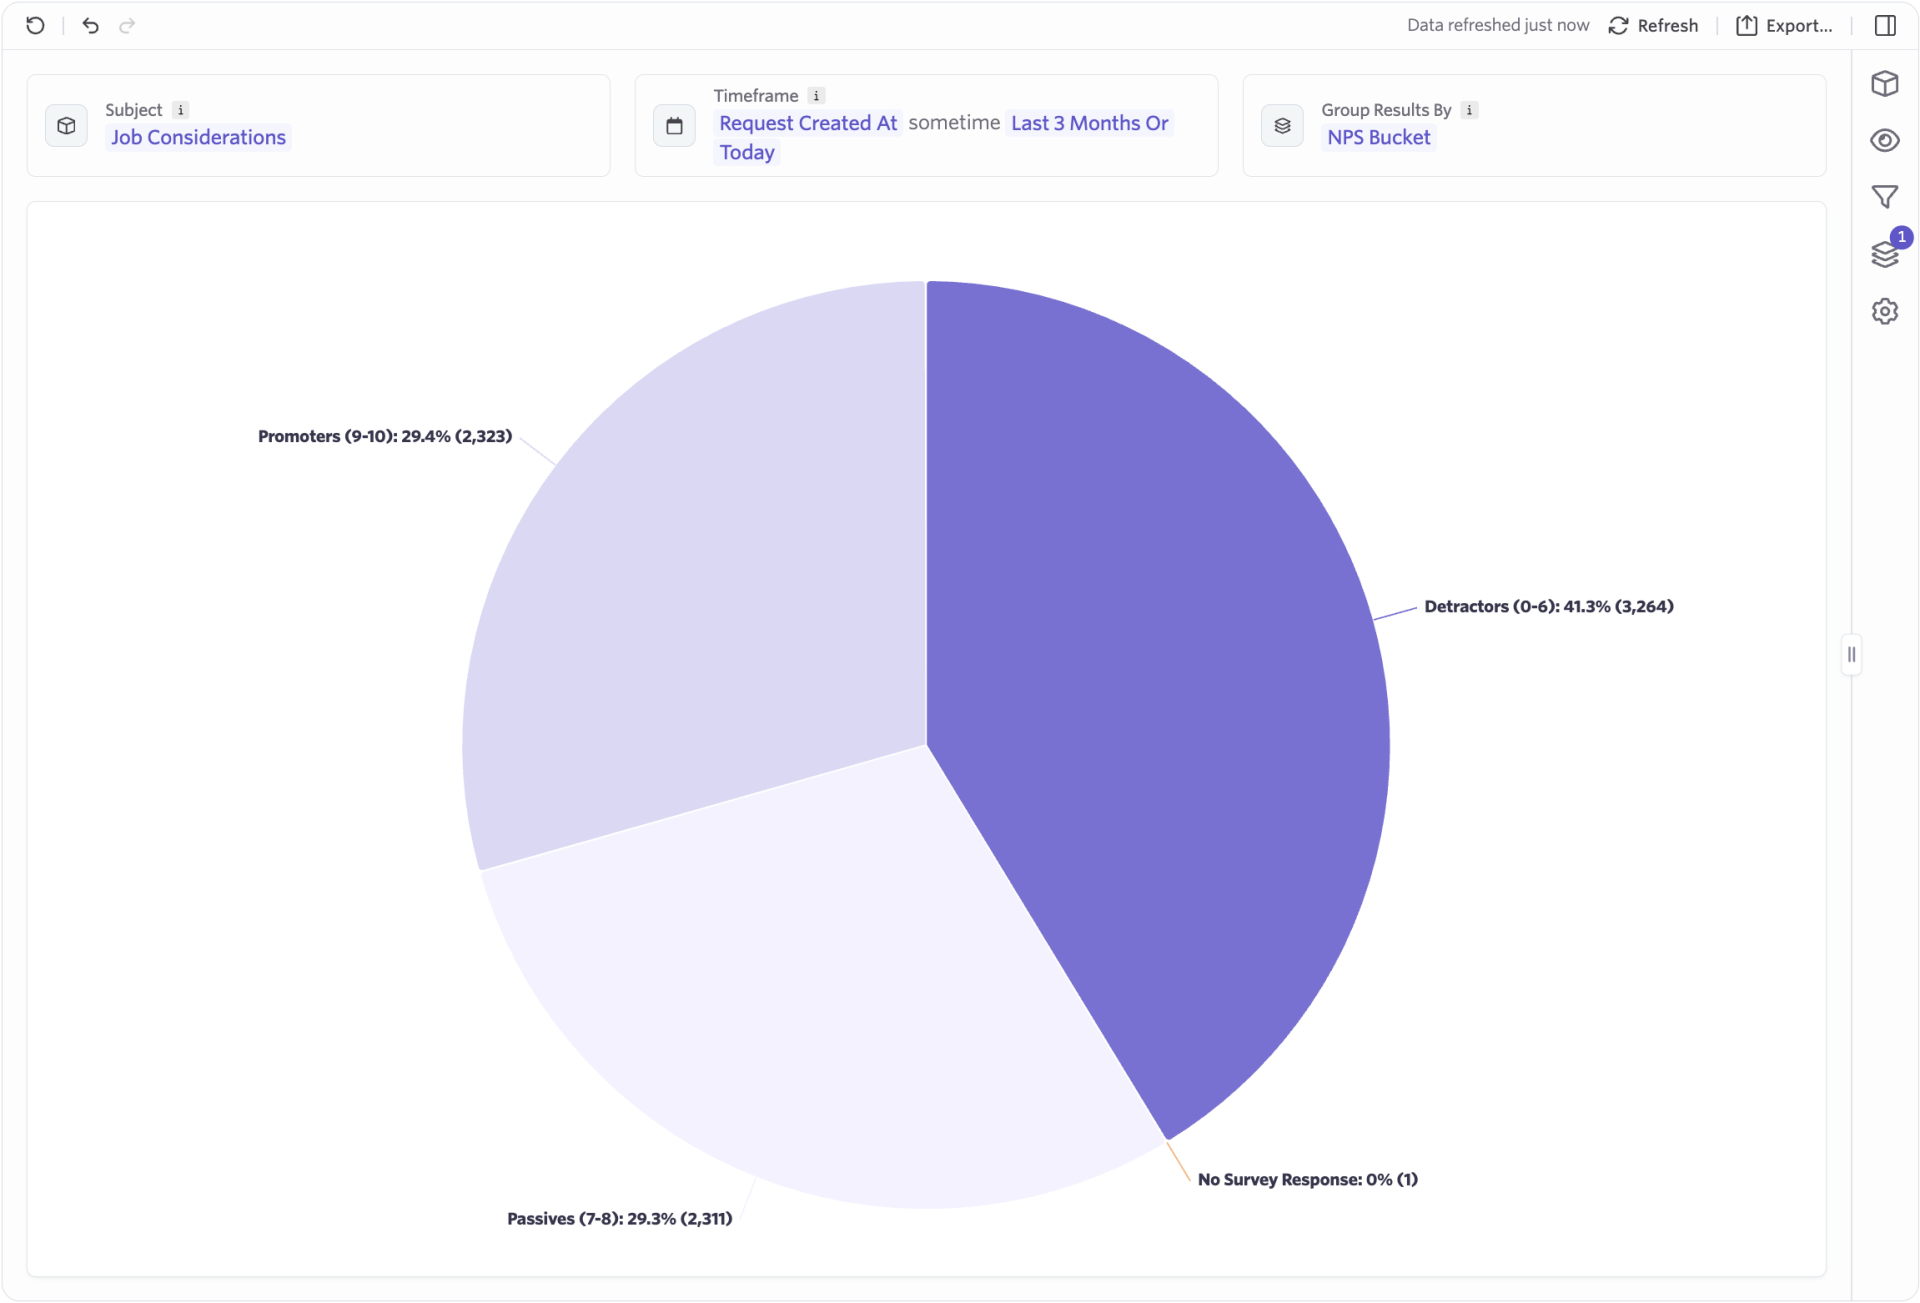
Candidate NPS
Groups Candidate Experience Survey responses into Promoter, Passive, and Detractor categories.
Benefits & Use CasesTurns raw NPS numbers into clear categories for easier storytelling.
- Add a chart showing candidate experience health
- Group NPS by department, recruiter, or stage
- Report on trends in candidate satisfaction over time
- Add a Calculated Field on the Candidate Experience Survey object.
- Set Buckets:
- Promoter (9–10)
- Passive (7-8)
- Detractor (0-6)
💡Take it a step further: Pair with Stage Name in a pivot to uncover where detractors are created.
Empty space, drag to resize
Example 4:
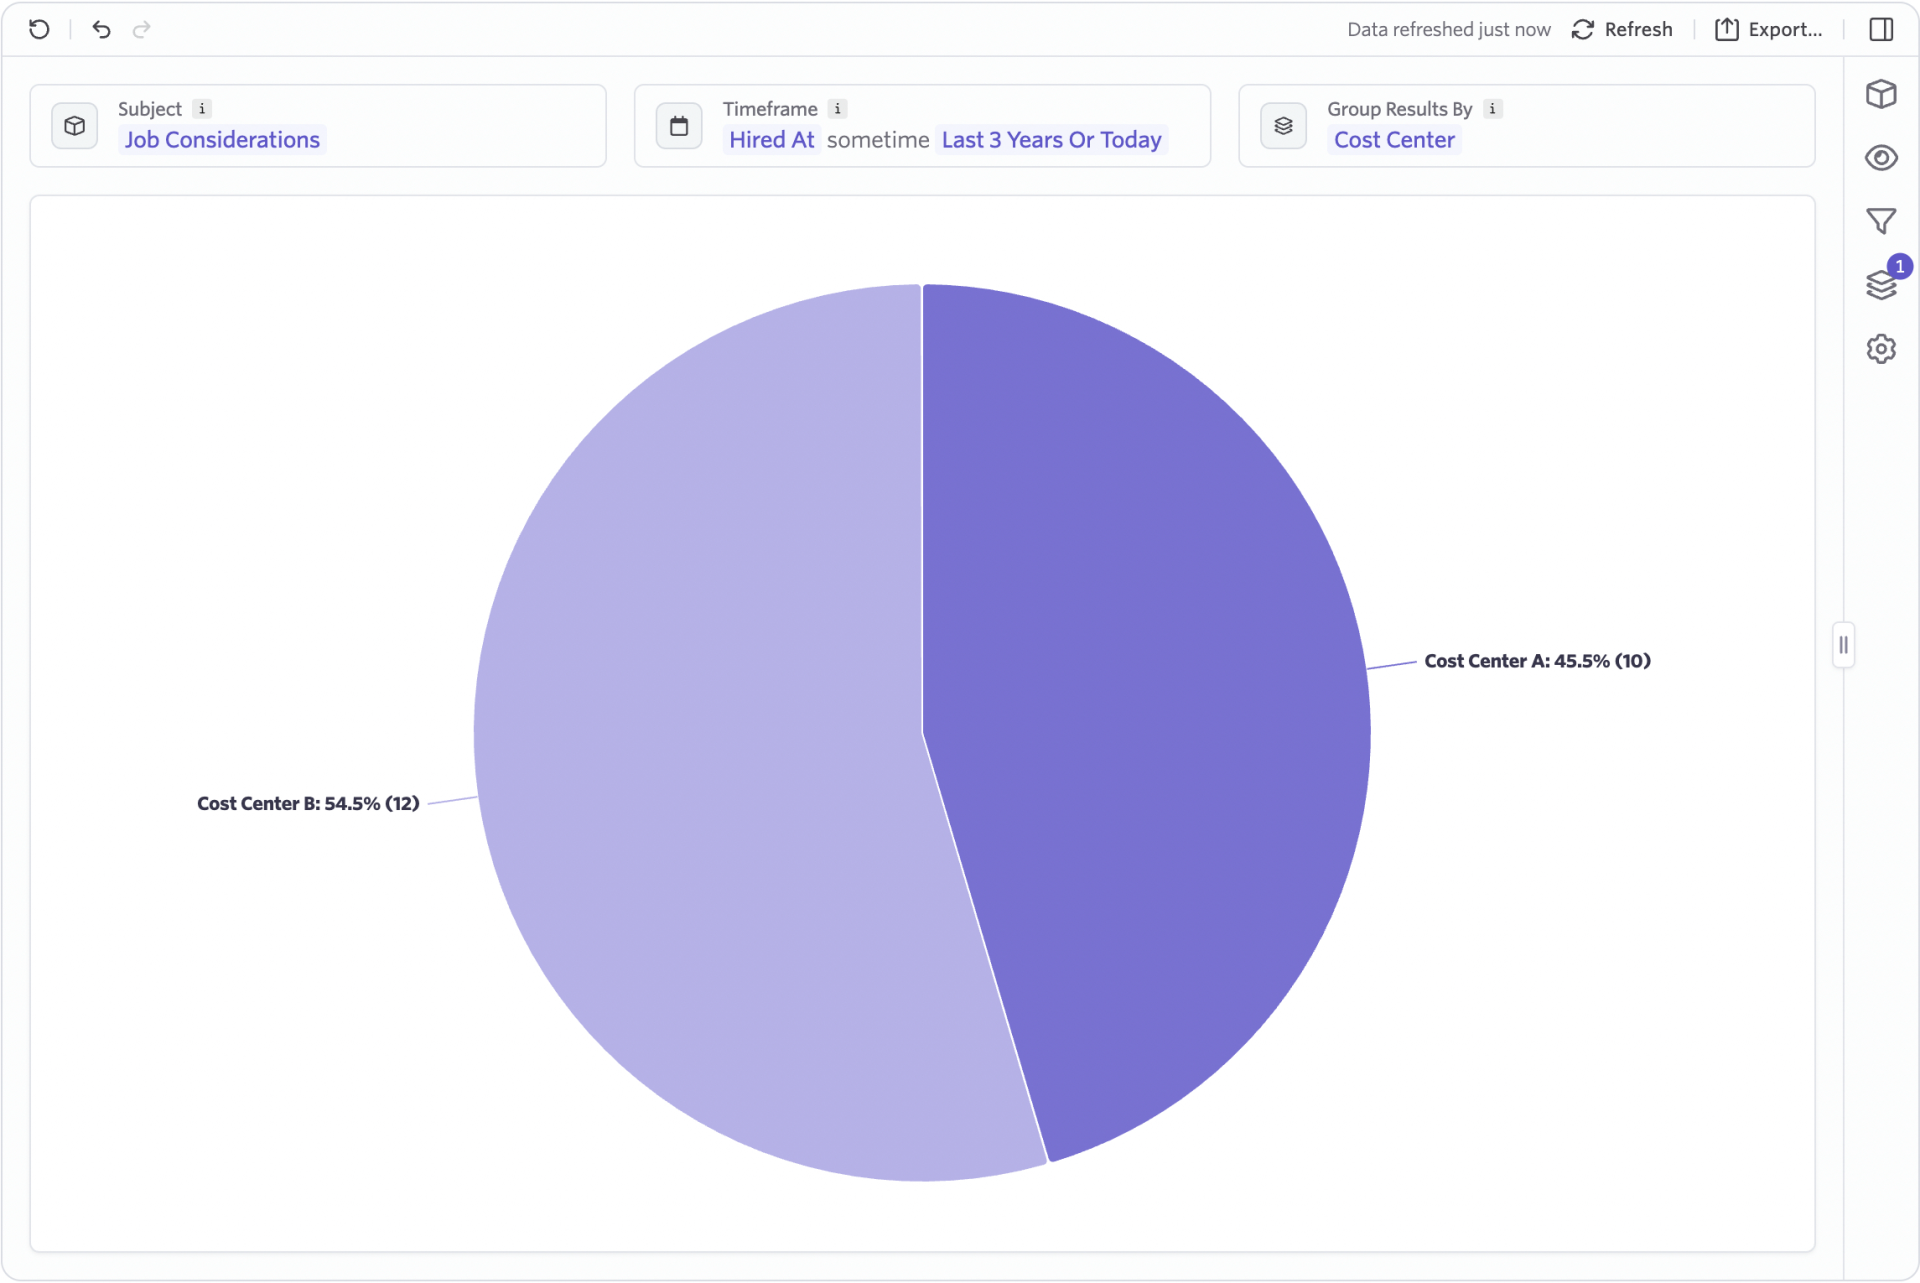
Cost Center Grouping
Groups departments or teams into higher-level cost center buckets.
Benefits & Use CasesReport on cost centers without altering the department structure in Ashby.
- Add to finance-facing dashboards
- Track spend by cost center
- Segment hiring velocity by business unit
- Create a Calculated Field on the Jobs object.
- Define parent/child relationships to roll up multiple departments into one cost center
💡Take it a step further: Layer cost centers into Headcount Plan reports to align recruiting output with budget.
Empty space, drag to resize
Example 5:
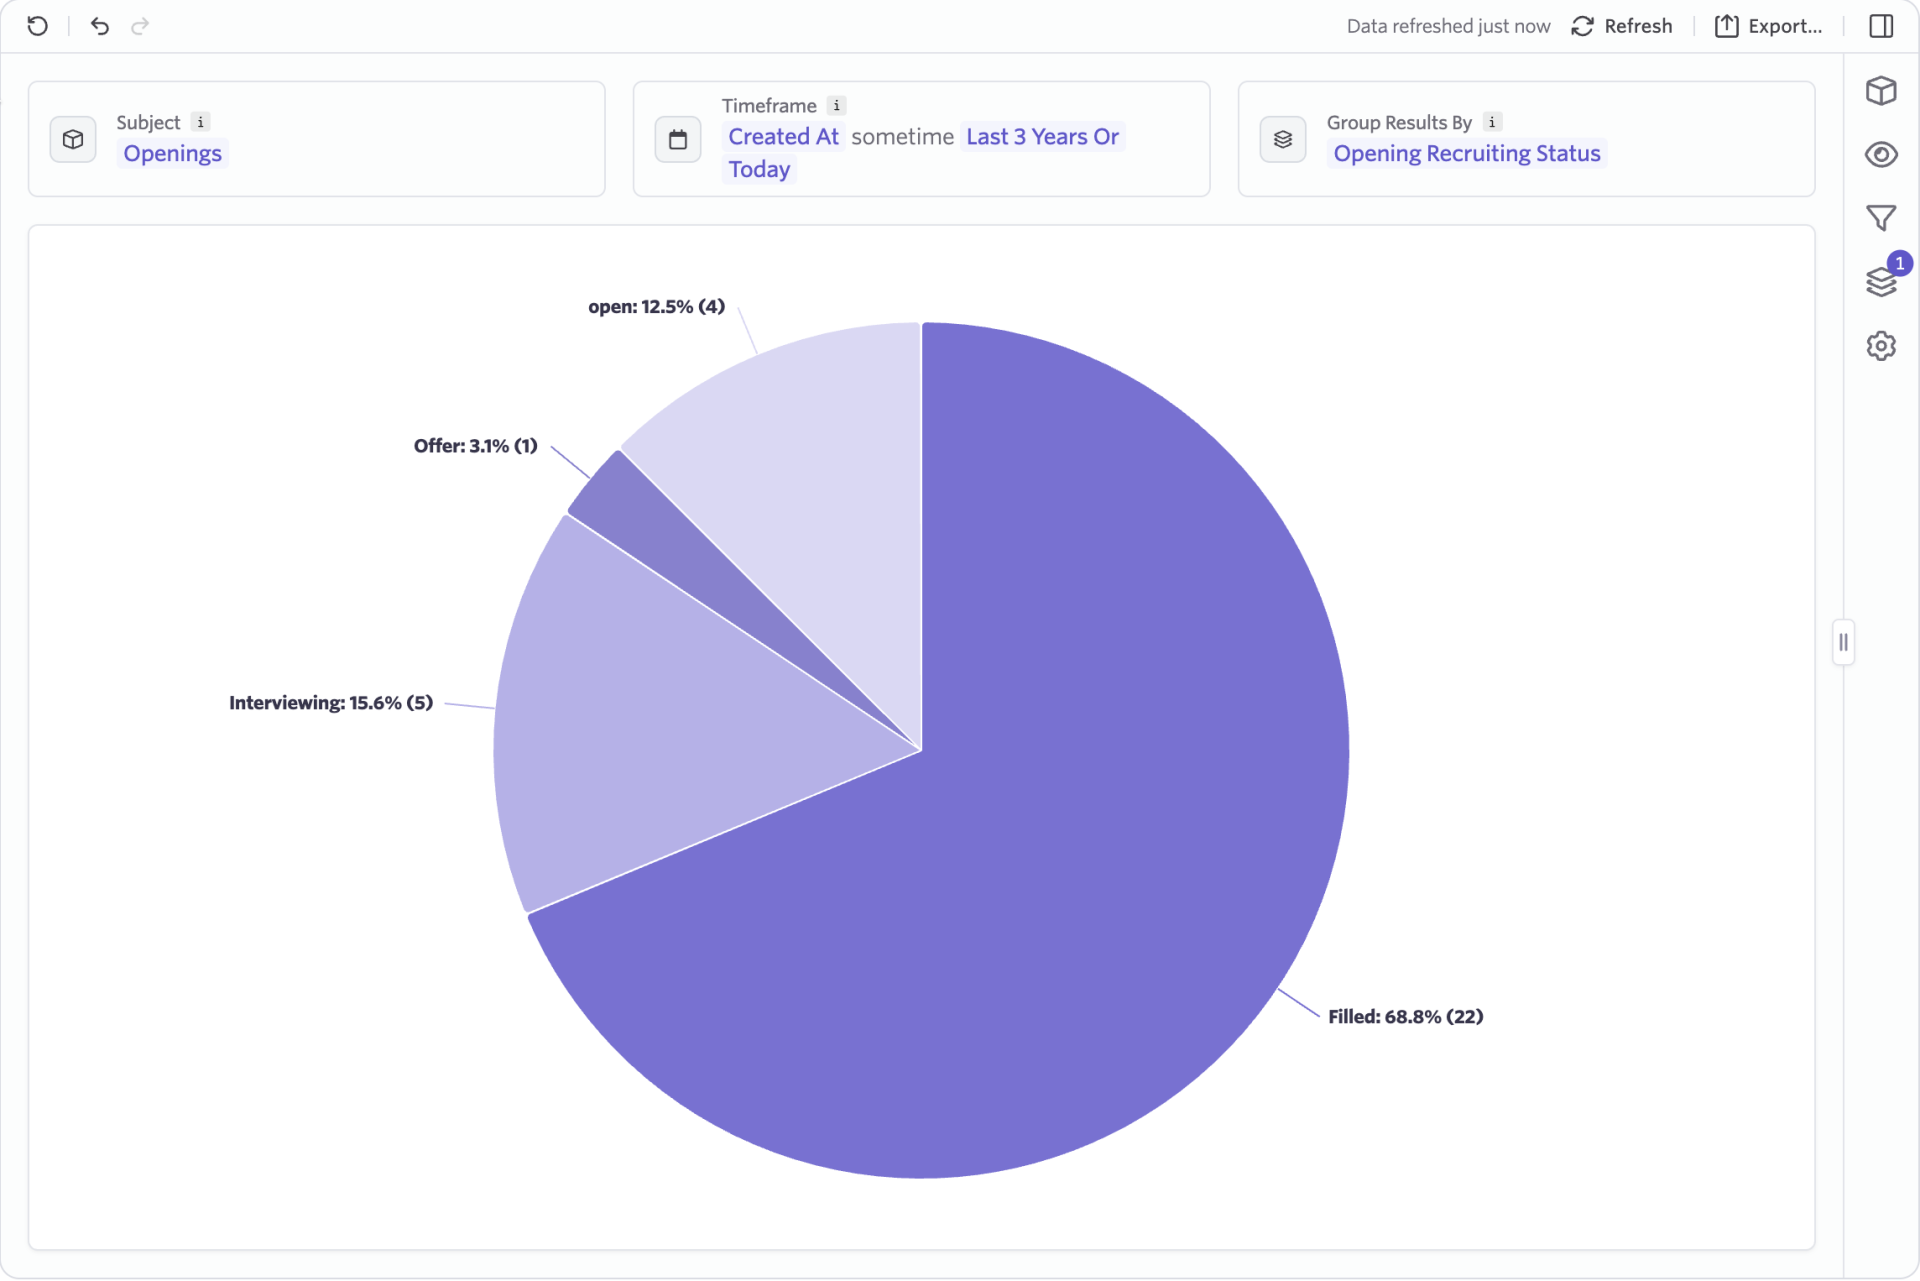
Recruiting Status
Tracks where each opening is in the recruiting process based on its current activity or status.
Benefits & Use CasesGives visibility into how openings are progressing toward being filled and helps identify where roles may be stuck or moving slower than expected.
- Visualize openings by stage (Approved, Open, Interviewing, Offer, or Filled)
- Use in the Openings Dashboard to monitor recruiting progress
- Create a Calculated Field on the Openings object.
- Create buckets based on status and the number of candidates in the Offer and Active stage types.
💡Take it a step further: Use this field to visualize how openings move through recruiting milestones based on hiring team members and department.